Researchers leverage inkjet printing to make a portable multispectral 3D camera

Researchers leverage inkjet printing to make a portable multispectral 3D camera
Researchers used inkjet printing to create a multispectral version of a light field camera, which fits in the palm of the hand. The 3D camera could be useful for applications such as autonomous driving, classification of recycled materials and remote sensing. Credit: Maximilian Schambach, Karlsruhe Institute of Technology

Researchers have used inkjet printing to create a compact multispectral version of a light field camera. The camera, which fits in the palm of the hand, could be useful for many applications including autonomous driving, classification of recycled materials and remote sensing.

3D spectral information can be useful for classifying objects and materials; however, capturing 3D spatial and spectral information from a scene typically requires multiple devices or time-intensive scanning processes. The new light field camera solves this challenge by simultaneously acquiring 3D information and spectral data in a single snapshot.

“To our knowledge, this is the most advanced and integrated version of a multispectral light field camera,” said research team leader Uli Lemmer from the Karlsruhe Institute of Technology in Germany. “We combined it with new AI methods for reconstructing the depth and spectral properties of the scene to create an advanced sensor system for acquiring 3D information.”

In the journal Optics Express, the researchers report that the new camera and image reconstruction methods can be used to distinguish objects in a scene based on their spectral characteristics. Using inkjet printing to make the camera’s key optical components allows it to be easily customized or manufactured in large volumes.

“Reconstructed 3D data from camera images are finding widespread use in virtual and augmented reality, autonomous cars, robotics, smart home devices, remote sensing and other applications,” said Michael Heizmann, a member of the research team.

“This new technology could, for example, allow robots to better interact with humans or improve the accuracy of classifying and separating materials in recycling. It could also be potentially used to classify healthy and diseased tissues.”

Researchers leverage inkjet printing to make a portable multispectral 3D camera
Inkjet printing was used to deposit single droplets of material to form individual lenses on one side of ultrathin microscope slides (i). After curing (ii), fully aligned color filter arrays were printed on the opposite side of the microscope slides (iii). The resulting optical component was integrated directly onto a CMOS camera chip and placed in a camera housing (iv). Credit: Qiaoshuang Zhang, Karlsruhe Institute of Technology

Adding color with inkjet printing

Light field cameras, also called plenoptic cameras, are specialized imaging devices that capture the direction and intensity of light rays. After image acquisition, computational processing is used to reconstruct 3D image information from the acquired data. These cameras typically use microlens arrays that are aligned with the pixels of a high-resolution camera chip.

To create a multispectral light field camera, the researchers used inkjet printing to deposit a single droplet of material to form each individual lens on one side of ultrathin microscope slides and then printed fully aligned color filter arrays on the opposite side of the microscope slides. The resulting optical component was integrated directly onto a CMOS camera chip. The inkjet printing method allowed precise alignment between the optical components, significantly reducing the manufacturing complexity and enhancing efficiency.

Because this setup produces spectral and depth information that are interwoven in the camera image, the researchers developed methods to separate each component. They found that an approach based on deep learning worked best for extracting the desired information directly from the acquired measurements.

Researchers leverage inkjet printing to make a portable multispectral 3D camera
The researchers used the new camera and deep-learning method to produce these reconstructed views in different color channels (false-color representation). Credit: Maximilian Schambach, Karlsruhe Institute of Technology

Spectral-based object detection

“Tackling the challenge of creating a multispectral light field camera was only possible by combining recent advances from manufacturing, system design and AI-based image reconstruction,” said Qiaoshuang Zhang, first author of the paper. “This work pushes the boundaries of inkjet printing—a versatile method with high precision and industrial scalability—for manufacturing photonic components.”

The researchers tested the camera by recording a test scene that contained multicolor 3D objects at different distances. The image reconstruction algorithm was trained and tested on many synthetic and real multispectral images. The results demonstrate that the prototype camera can simultaneously acquire 3D spatial and spectral information and that different objects can be imaged and distinguished by their different spectral composition and depth information within one single snapshot.

Now that they have completed this first proof-of-concept, the researchers are exploring various applications where a light field camera with an ability to acquire multispectral information could be useful.

More information: Qiaoshuang Zhang et al, Compact multispectral light field camera based on an inkjet-printed microlens array and color filter array, Optics Express (2024). DOI: 10.1364/OE.521646 

Qiaoshuang Zhang

New theory describes how waves carry information from surroundings

What waves know about their surroundings
Teflon objects (orange cylinders) were placed in a waveguide with a rectangular cross-section. Then, an electromagnetic signal (blue wavefront) was injected from the right to extract information about the metallic cuboid shown in gray. By measuring the wave field in the area indicated in red, the researchers could show how information is generated and transported by an electromagnetic signal. For example, the flow of information about the horizontal position of the cuboid is shown in the inset at the bottom right (blue arrows). One sees that information is generated on the cuboid’s right-hand side and then transported to the right towards the opening of the waveguide. Credit: Nature Physics (2024). DOI: 10.1038/s41567-024-02519-8

Waves pick up information from their environment through which they propagate. A theory of information carried by waves has now been developed at TU Wien—with astonishing results that can be utilized for technical applications.

Ultrasound is used to analyze the body, radar systems to study airspace or seismic waves to study the interior of our planet. Many areas of research are dealing with waves that are deflected, scattered or reflected by their surroundings. As a result, these waves carry a certain amount of information about their environment, and this information must then be extracted as comprehensively and precisely as possible.

Searching for the best way to do this has been the subject of research around the world for many years. TU Wien has now succeeded in describing the information carried by a wave about its environment with mathematical precision. This has made it possible to show how waves pick up information about an object and then transport it to a measuring device.

This can now be used to generate customized waves to extract the maximum amount of information from the environment—for more precise imaging processes, for example. This theory was confirmed with microwave experiments. The results were published in the journal Nature Physics.

Where exactly is the information located?

“The basic idea is quite simple: you send a wave at an object and the part of the wave that is scattered back from the object is measured by a detector,” says Prof Stefan Rotter from the Institute of Theoretical Physics at TU Wien.

“The data can then be used to learn something about the object—for example, its precise position, speed or size.” This information about the environment that this wave carries with it is known as “Fisher information.”

However, it is often not possible to capture the entire wave. Usually, only part of the wave reaches the detector. This raises the question: Where exactly is this information actually located in the wave? Are there parts of the wave that can be safely ignored? Would a different waveform perhaps provide more information to the detector?

“To get to the bottom of these questions, we took a closer look at the mathematical properties of this Fisher information and came up with some astonishing results,” says Rotter.

“The information fulfills a so-called continuity equation—the information in the wave is preserved as it moves through space, according to laws which are very similar laws to the conservation of energy, for example.”

A comprehensible path of information

Using the newly developed formalism, the research team has now been able to calculate exactly at which point in space the wave actually carries how much information about the object. It turns out that the information about different properties of the object (such as position, speed and size) can be hidden in completely different parts of the wave.

As the theoretical calculations show, the information content of the wave depends precisely on how strongly the wave is influenced by certain properties of the object under investigation.

“For example, if we want to measure whether an object is a little further to the left or a little further to the right, then the Fisher information is carried precisely by the part of the wave that comes into contact with the right and left edges of the object,” says Jakob Hüpfl, the doctoral student who played a key role in the study.

“This information then spreads out, and the more of this information reaches the detector, the more precisely the position of the object can be read from it.”

Microwave experiments confirm the theory

In Ulrich Kuhl’s group at the University of Cote d’Azur in Nice, experiments were carried out by Felix Russo as part of his master’s thesis: A disordered environment was created in a microwave chamber using randomly positioned Teflon objects. Between these objects, a metallic rectangle was placed whose position was to be determined.

Microwaves were sent through the system and then picked up by a detector. The question now was: How well can the position of the metal rectangle be deduced from the waves caught in the detector in such a complicated physical situation and how does the information flow from the rectangle to the detector?

By precisely measuring the microwave field, it was possible to show exactly how the information about the horizontal and vertical position of the rectangle spreads: it emanates from the respective edges of the rectangle and then moves along with the wave—without any information being lost, just as predicted by the newly developed theory.

Possible applications in many areas

“This new mathematical description of Fisher information has the potential to improve the quality of a variety of imaging methods,” says Rotter. If it is possible to quantify where the desired information is located and how it propagates, then it also becomes possible, for example, to position the detector more appropriately or to calculate customized waves that transport the maximum amount of information to the detector.

“We tested our theory with microwaves, but it is equally valid for a wide variety of waves with different wavelengths,” emphasizes Rotter. “We provide simple formulas that can be used to improve microscopy methods as well as quantum sensors.”

by Vienna University of Technology

Guiding the design of silicon devices with improved efficiency

by University of Michigan

Guiding the design of silicon devices with improved efficiency
Analysis of different contributions to the overall AMR rate. (a) Relative importance of the three different initial valley arrangements for electrons in the eeh process, which are illustrated in (b) with the f-type arrangement contributing most strongly. Strength of phonon-assisted AMR for eeh (solid black) and hhe (red dash) processes as a function of phonon energy (c) and wave vector magnitude (d), where the strongest peaks are associated with TA phonons, highlighted in the inset phonon dispersion. (e) The distribution of excited carrier states throughout the first Brillioun zone for the direct and phonon-assisted eeh and phonon-assisted hhe processes, with slices removed to show the internal structure. Credit: Kyle Bushick, University of Michigan

Silicon is one of the most pervasive functional materials of the modern age, underpinning semiconductor technologies ranging from microelectronics to solar cells. Indeed, silicon transistors enable computing applications from cell phones to supercomputers, while silicon photovoltaics are the most widely deployed solar-cell technology to date.

The U.S. Department of Energy (DOE) reports that nearly 50% of new electric generation capacity in 2022 came from solar cells, and according to the International Energy Agency (IEA), silicon has a 95% market share. Yet despite silicon’s undisputed importance to our modern way of life, many open questions remain about its fundamental physical properties.

In semiconductor devices, the functionality of the material comes from the motion and interactions of subatomic particles such as electrons (which have negative charge) and holes (the absence of an electron from an otherwise occupied state that itself behaves like a positively charged particle), which are called carriers as they “carry” electrical charge through the material.

For example, in a solar cell, the material absorbs incoming light, and the absorbed energy is converted into pairs of electrons and holes. These excited electron and holes then move to opposite ends of the solar cell and generate electricity.

Unfortunately, the electrons and holes can also interact in undesirable ways that convert their energy to heat and limit the efficiency of devices. One such loss mechanism occurs when carriers recombine and convert their energy to heat by interacting with a defect in the material. In many cases this defect-mediated recombination can be reduced by improving the quality of the material.

Other interactions, however, are intrinsic to a material and cannot be eliminated even in perfectly pure samples. Auger-Meitner recombination (AMR), historically known also as Auger recombination, is one such interaction. It is named after Lise Meitner and Pierre Auger, two pioneers of nuclear science who independently discovered this effect in atoms.

The new naming convention of the Auger-Meitner effect recognizes the contributions of Lise Meitner, a female Austrian physicist and the eponym of the Meitnerium chemical element, who independently discovered the process a year prior to Pierre Auger.

In the AMR process in semiconductors, one electron and one hole recombine, transferring their energy to a third carrier. The high-energy carrier can then thermalize or leak out of a device, generating heat and reducing the energy-conversion efficiency or reducing the number of available carriers. Unfortunately, despite decades of research, the specific atomistic mechanisms of AMR in silicon have eluded researchers to this date.

With a new implementation of a computational methodology to accurately calculate AMR rates from first principles—that is using only the physical constants of the universe and the atomic number of silicon as input—Dr. Kyle Bushick and Prof. Emmanouil Kioupakis of Materials Science and Engineering at the University of Michigan have provided the first comprehensive characterization of this important recombination process in silicon. This computational approach is key to gaining a full understanding of the AMR mechanism, because it is a process that does not emit light, making it very difficult to study in the lab.

With the aid of supercomputing resources at the National Energy Research Scientific Computing Center (NERSC) of Lawrence Berkeley National Lab, Bushick and Kioupakis were able to carry out the calculations of AMR in silicon, gaining insights to the behavior of the material at an atomic level.

One reason the AMR process in silicon has not been fully understood is that it includes multiple permutations. On one hand, the excited (third) carrier can either be an electron, or a hole, giving rise to the electron-electron-hole (eeh) and hole-hole-electron (hhe) processes, respectively.

Furthermore, AMR can be both direct, where only the three carriers participate, or phonon-assisted, where one of the carriers interacts with the vibrating atoms (phonons) to transfer additional momentum. While experiments can characterize the combined total AMR rate, parsing out the different contributions from these different components can be much harder. However, by using predictive atomistic calculations, each individual component can be directly computed and characterized.

Although past work had investigated the direct process using such calculations, it was clear that the direct process alone didn’t capture the full experimental picture. By overcoming the added complexity of calculating both the direct and phonon-assisted processes at the same level of theory, many of the unanswered questions about AMR in silicon could be addressed. Additionally, achieving such a detailed understanding of the process then opens the door for finding solutions to reduce the impact of AMR on device efficiency.

In their report, published in Physical Review Letters, Bushick and Kioupakis unequivocally elucidate the importance of the phonon-assisted AMR process in silicon.

“We found that the electron-phonon interactions not only account for the entirety of the hhe process, which was hypothesized in previous works but never conclusively demonstrated, but also for a significant portion of the eeh process, a finding that had been a subject of unresolved debate in the literature,” says Bushick, a recently graduated Ph.D. student of Materials Science and Engineering and a DOE Computational Science Graduate Fellow.

Furthermore, they highlight a potential pathway for altering AMR in silicon by applying strain to the material, a conclusion made possible by their newly implemented methodology.

This work provides a hitherto inaccessible fundamental understanding of an important intrinsic loss mechanism in the world’s most important semiconductor. This understanding, which has eluded scientists for decades, can help design better devices with improved performance by reducing the occurrence of the undesirable AMR process.

Emmanouil Kioupakis, Associate Professor of Materials Science and Engineering and Karl F. and Patricia J. Betz Family Faculty Scholar at the University of Michigan notes, “Ultimately, this work paves the way to understand and mitigate losses in silicon devices such as transistors or solar cells. Considering the size of these industries, even small improvements can lead to massive benefits.”

More information: Kyle Bushick et al, Phonon-Assisted Auger-Meitner Recombination in Silicon from First Principles, Physical Review Letters (2023). DOI: 10.1103/PhysRevLett.131.076902

Journal information: Physical Review Letters 

Provided by University of Michigan 

Long-lived quantum state points the way to solving a mystery in radioactive nuclei

by Dawn Levy, Oak Ridge National Laboratory

Long-lived quantum state points the way to solving a mystery in radioactive nuclei
A beam of excited sodium-32 nuclei implants in the FRIB Decay Station initiator, which detects decay signatures of isotopes. Credit: Gary Hollenhead, Toby King and Adam Malin/ORNL, U.S. Dept. of Energy

Timothy Gray of the Department of Energy’s Oak Ridge National Laboratory led a study that may have revealed an unexpected change in the shape of an atomic nucleus. The surprise finding could affect our understanding of what holds nuclei together, how protons and neutrons interact and how elements form.

“We used radioactive beams of excited sodium-32 nuclei to test our understanding of nuclear shapes far from stability and found an unexpected result that raises questions about how nuclear shapes evolve,” said Gray, a nuclear physicist. The results are published in Physical Review Letters.

The shapes and energies of atomic nuclei can shift over time between different configurations. Typically, nuclei live as quantum entities that have either spherical or deformed shapes. The former look like basketballs, and the latter resemble American footballs.

How shapes and energy levels relate is a major open question for the scientific community. Nuclear structure models have trouble extrapolating to regions with little experimental data.

For some exotic radioactive nuclei, the shapes predicted by traditional models are the opposite of those observed. Radioactive nuclei that were expected to be spherical in their ground states, or lowest-energy configurations, turned out to be deformed.

What can turn a quantum state on its head?

In principle, the energy of an excited deformed state can drop below that of a spherical ground state, making the spherical shape the high-energy one. Unexpectedly, this role reversal appears to be happening for some exotic nuclei when the natural ratio of neutrons to protons becomes unbalanced. Yet, the post-reversal excited spherical states have never been found. It is as though once the ground state becomes deformed, all the excited states do, too.

Many examples exist of nuclei with spherical ground states and deformed excited states. Similarly, plenty of nuclei have deformed ground states and subsequent excited states that are also deformed—sometimes with different amounts or kinds of deformation. However, nuclei with both deformed ground states and spherical excited states are much more elusive.

Using data collected in 2022 from the first experiment at the Facility for Rare Isotope Beams, or FRIB, a DOE Office of Science user facility at Michigan State University, Gray’s team discovered a long-lived excited state of radioactive sodium-32. The newly observed excited state has an unusually long lifetime of 24 microseconds—about a million times longer than a typical nuclear excited state.

Long-lived excited states are called isomers. A long lifetime indicates that something unanticipated is going on. For example, if the excited state is spherical, a difficulty in returning to a deformed ground state could account for its long life.

The study involved 66 participants from 20 universities and national laboratories. Co-principal investigators came from Lawrence Berkeley National Laboratory, Florida State University, Mississippi State University, the University of Tennessee, Knoxville, and ORNL.

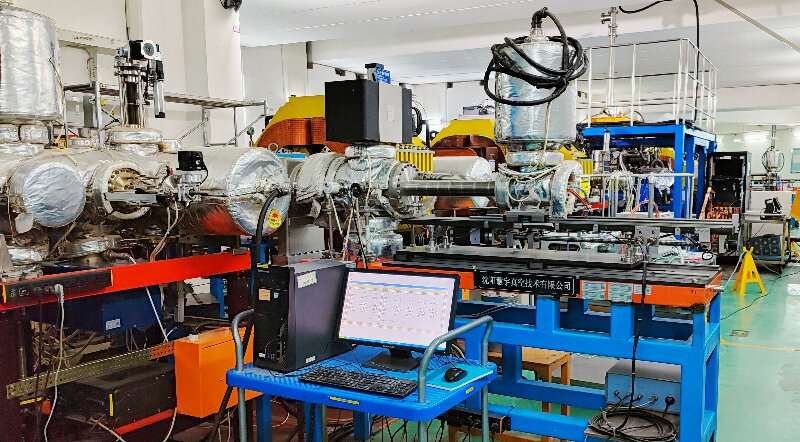
The 2022 experiment that generated the data used for the 2023 result employed the FRIB Decay Station initiator, or FDSi, a modular multidetector system that is extremely sensitive to rare isotope decay signatures.

“FDSi’s versatile combination of detectors shows that the long-lived excited state of sodium-32 is delivered within the FRIB beam and that it then decays internally by emitting gamma rays to the ground state of the same nucleus,” said ORNL’s Mitch Allmond, a co-author of the paper who manages the FDSi project.

To stop FRIB’s highly energetic radioactive beam, which travels at about 50% of the speed of light, an implantation detector built by UT Knoxville was positioned at FDSi’s center. North of the beam line was a gamma-ray detector array called DEGAi, comprising 11 germanium clover-style detectors and 15 fast-timing lanthanum bromide detectors. South of the beam line were 88 modules of a detector called NEXTi to measure time of flight of neutrons emitted in radioactive decay.

A beam of excited sodium-32 nuclei stopped in the detector and decayed to the deformed ground state by emitting gamma rays. Analysis of gamma-ray spectra to discern the time difference between beam implantation and gamma-ray emission revealed how long the excited state existed. The new isomer’s 24-microsecond existence was the longest lifetime seen among isomers with 20 to 28 neutrons that decay by gamma-ray emission. Approximately 1.8% of the sodium-32 nuclei were observed to be the new isomer.

“We can come up with two different models that equally well explain the energies and lifetime that we’ve observed in the experiment,” Gray said.

An experiment with higher beam power is needed to determine whether the excited state in sodium-32 is spherical. If it is, then the state would have six quantized units of angular momentum, which is a quality of a nucleus related to its whole-body rotation or the orbital motion of its individual protons and/or neutrons about the center of mass. However, if the excited state in sodium-32 is deformed, then the state would have zero quantized units of angular momentum.

A planned upgrade to FRIB will provide more power, increasing the number of nuclei in the beam. Data from the more intense beam will enable an experiment that distinguishes between the two possibilities.

“We’d characterize correlations between the angles of two gamma rays that are emitted in a cascade,” Gray said. “The two possibilities have very different angular correlations between the gamma rays. If we have enough statistics, we could disentangle the pattern that reveals a clear answer.”

More information: T. J. Gray et al, Microsecond Isomer at the N=20 Island of Shape Inversion Observed at FRIB, Physical Review Letters (2023). DOI: 10.1103/PhysRevLett.130.242501

Journal information: Physical Review Letters 

Provided by Oak Ridge National Laboratory 

Visualizing the microscopic phases of magic-angle twisted bilayer graphene

by Princeton University

Visualizing the microscopic phases of magic-angle twisted bilayer graphene
Scanning tunneling microscopy images of twisted bilayer graphene, which show the graphene atomic lattice (left panel) and the magic-angle graphene moiré superlattice (right panel). Credit: Kevin Nuckolls, Yazdani Group, Princeton University

A Princeton University-led team of scientists has imaged the precise microscopic underpinnings responsible for many quantum phases observed in a material known as magic-angle twisted bilayer graphene (MATBG). This remarkable material, which consists of twisted layers of carbon atoms arranged in a two-dimensional hexagonal pattern, has in recent years been at the forefront of research in physics, especially in condensed matter physics.

For the first time, the researchers were able to specifically capture unprecedentedly precise visualizations of the microscopic behavior of interacting electrons that give rise to the insulating quantum phase of MATBG. Additionally, through the use of novel and innovative theoretical techniques, they were able to interpret and understand these behaviors. Their study is published in the journal Nature.

The amazing properties of twisted bilayer graphene were first discovered in 2018 by Pablo Jarillo-Herrero and his team at the Massachusetts Institute of Technology (MIT). They showed that this material can be superconducting, a state in which electrons flow freely without any resistance. This state is vital to many of our everyday electronics, including magnets for MRIs and particle accelerators as well as in the making of quantum bits (called qubits) that are being used to build quantum computers.

Since that discovery, twisted bilayer graphene has demonstrated many novel quantum physical states, such as insulating, magnetic, and superconducting states, all of which are created by complex interactions of electrons. How and why electrons form insulating states in MATBG has been one of the key unsolved puzzles in the field.

The solution to this puzzle would not only unlock our understanding of both the insulator and the proximate superconductor, but also such behavior shared by many unusual superconductors that scientists seek to understand, including the high-temperature cuprate superconductors.

“MATBG shows a lot of interesting physics in a single material platform-much of which remains to be understood,” said Kevin Nuckolls, the co-lead author of the paper, who earned his Ph.D. in 2023 in Princeton’s physics department and is now a postdoctoral fellow at MIT. “This insulating phase, in which electrons are completely blocked from flowing, has been a real mystery.”

To create the desired quantum effects, researchers place two sheets of graphene on top of each other with the top layer angled slightly. This off-kilter position creates a moiré pattern, which resembles and is named after a common French textile design. Importantly, however, the angle at which the top layer of graphene must be positioned is precisely 1.1 degrees. This is the “magic” angle that produces the quantum effect; that is, this angle induces strange, strongly correlated interactions between the electrons in the graphene sheets.

While physicists have been able to demonstrate different quantum phases in this material, such as the zero-resistance superconducting phase and the insulating phase, there has been very little understanding of why these phases occur in MATBG. Indeed, all previous experiments involving MATBG give good demonstrations of what the system is capable of producing, but not why the system is producing these states.

And that “why” became the basis for the current experiment.

“The general idea of this experiment is that we wanted to ask questions about the origins of these quantum phases—to really understand what exactly are the electrons doing on the graphene atomic scale,” said Nuckolls. “Being able to probe the material microscopically, and to take images of its correlated states—to fingerprint them, effectively—gives us the ability to discern very distinctly and precisely the microscopic origins of some of these phases. Our experiment also helps guide theorists in the search for phases that were not predicted.”

The study is the culmination of two years of work and was achieved by a team from Princeton University and the University of California, Berkeley. The scientists harnessed the power of the scanning tunneling microscope (STM) to probe this very minute realm. This tool relies on a technique called “quantum tunneling,” where electrons are funneled between the sharp metallic tip of the microscope and the sample. The microscope uses this tunneling current rather than light to view the world of electrons on the atomic scale. Measurements of these quantum tunneling events are then translated into high resolution, highly sensitive images of materials.

However, the first step—and perhaps the most crucial step in the experiment’s success—was the creation of what the researchers refer to as a “pristine” sample. The surface of carbon atoms that constituted the twisted bilayer graphene sample had to have no flaws or imperfections.

Visualizing the microscopic phases of magic-angle twisted bilayer graphene
High-resolution images measured using the scanning tunneling microscope show quantum interference patterns in magic-angle graphene. The ways that these patterns change across the material tells researchers about the microscopic origins of its quantum states. Credit: Kevin Nuckolls, Yazdani Group, Princeton University

“The technical breakthrough that made this paper happen was our group’s ability to make the samples so pristine in terms of their cleanliness such that these high-resolution images that you see in the paper were possible,” said Ali Yazdani, the Class of 1909 Professor of Physics and Director of the Center for Complex Materials at Princeton University. “In other words, you have to make one hundred thousand atoms without a single flaw or disorder.”

The actual experiment involved placing the graphene sheets in the correct “magic angle,” at 1.1 degrees. The researchers then positioned the sharp, metallic tip of the STM over the graphene sample and measured the quantum mechanical tunneling current as they moved the tip across the sample.

“Electrons at this quantum scale are not only particles, but they are also waves,” said Ryan Lee, a graduate student in the Department of Physics at Princeton and one of the paper’s co-lead authors. “And essentially, we’re imaging wave-like patterns of electrons, where the exact way that they interfere (with each other) is telling us some very specific information about what is giving rise to the underlying electronic states.”

This information allowed the researchers to make some very incisive interpretations about the quantum phases that were produced by the twisted bilayer graphene. Importantly, the researchers used this information to focus on and solve the long-standing puzzle that for many years has challenged researchers working in this field, namely, the quantum insulating phase that occurs when graphene is tuned to its magic angle.

To help understand this from a theoretical viewpoint, the Princeton researchers collaborated with a team from the University of California-Berkeley, led by physicists B. Andrei Bernevig at Princeton and Michael Zaletel at Berkeley. This team developed a novel and innovative theoretical framework called “local order parameter” analysis to interpret the STM images and understand what the electrons were doing—in other words, how they were interacting—in the insulating phase. What they discovered was that the insulating state occurs because of the strong repulsion between the electrons, on the microscopic level.

“In magic-angle twisted bilayer graphene, the challenge was to model the system,” said Tomohiro Soejima, a graduate student and theorist at U.C. Berkeley and one of the paper’s co-lead authors. “There were many competing theories, and no one knew which one was correct. Our experiment of ‘finger-printing’ was really crucial because that way we could pinpoint the actual electronic interactions that give rise to the insulating phase.”

By using this theoretical framework, the researchers were able, for the first time, to make a measurement of the observed wave functions of the electrons. “The experiment introduces a new way of analyzing quantum microscopy,” said Yazdani.

The researchers suggest the technology—both the imagery and the theoretical framework—can be used in the future to analyze and understand many other quantum phases in MATBG, and ultimately, to help comprehend new and unusual material properties that may be useful for next-generation quantum technological applications.

“Our experiment was a wonderful example of how Mother Nature can be so complicated—can be really confusing—until you have the right framework to look at it, and then you say, ‘oh, that’s what’s happening,'” said Yazdani.

More information: Kevin P. Nuckolls et al, Quantum textures of the many-body wavefunctions in magic-angle graphene, Nature (2023). DOI: 10.1038/s41586-023-06226-x

Journal information: Nature 

Provided by Princeton University 

Line-scan Raman micro-spectroscopy provides rapid method for micro and nanoplastics detection

by Liu Jia, Chinese Academy of Sciences

Line-scan Raman micro-spectroscopy provides rapid method for micro and nanoplastics detection
Credit: Talanta (2023). DOI: 10.1016/j.talanta.2023.125067

Microplastics—plastics particles smaller than 5 mm in size—have caused an environmental pollution issue that cannot be ignored by our society. Raman spectroscopy technology, with its non-contact, non-destructive and chemical-specific characteristics, has been widely applied in the field of microplastics detection. However, conventional point confocal Raman techniques are limited to single-point detection, impeding the detection speed.

In a study published in Talanta, a research group led by Prof. Li Bei from the Changchun Institute of Optics, Fine Mechanics and Physics (CIOMP) of the Chinese Academy of Sciences (CAS), in collaboration with Prof. Wolfgang Langbein from Cardiff University, proposed a novel line-scan Raman micro-spectroscopy technique for rapid identification of micro- and nanoplastics.

Based on the fundamental principles of confocal Raman spectroscopy, the focused excitation spot transforms from a convergent point into a convergent line with diffraction-limited width. The optical setup employs a conjugate imaging design. In the two-dimensional image recorded by the charge-coupled device (CCD), the vertical dimension maps the vertical dimension of the sample along the excitation line, while the spectrum is dispersed along the horizontal dimension. In this way, a single acquisition provides the spectra for all spatial positions along the excitation line.

Researchers developed a confocal line-scan Raman micro-spectroscopy system, established a preprocessing workflow for line-scan Raman spectral data, and applied the factorization into susceptibilities and concentrations (FSC3) algorithm to obtain Raman hyperspectral images. They employed a concave cylindrical lens to generate the excitation line and improved the uniformity of energy distribution using a Powell lens.

Plastic beads of various sizes were used for size and composition identification. The detection of beads with a diameter of 200 nm, which is smaller than the diffraction limit, was realized, demonstrating the exceptional sensitivity of the line-scan Raman spectroscopy system.

Furthermore, four types of plastic powder samples were used for a large-scale area of 1.2 mm in length and 40 μm in height measurement. Impressively, the imaging time is 20 minutes to obtain a 240,000-pixel Raman image. Compared with point confocal Raman imaging, the line-scan confocal Raman technology increases the imaging speed by two orders of magnitude.

Line-scan Raman micro-spectroscopy offers non-destructive analysis with high sensitivity and high-throughput. By employing appropriate sampling techniques such as filtration or sedimentation, environmental samples from various sources, including water, soil and air, are accessible.

More information: Qingyi Wu et al, Rapid identification of micro and nanoplastics by line scan Raman micro-spectroscopy, Talanta (2023). DOI: 10.1016/j.talanta.2023.125067

Provided by Chinese Academy of Sciences

Fluid dynamics researchers shed light on how partially submerged objects experience drag

by Brown University

Brown fluid dynamics researchers shed light on how partially submerged objects experience drag
In new study, Brown researchers describe how drag on a partially submerged object may be several times greater than drag on a fully submerged object. Image courtesy of the Harris Lab. Credit: Harris Lab.

One of the most common and practically useful experiments in all of fluid dynamics involves holding an object in air or submerging it fully underwater, exposing it to a steady flow to measure its resistance in the form of drag. Studies on drag resistance have led to technological advances in airplane and vehicle design and even advanced our understanding of environmental processes.

That’s much tougher these days. As one of the most thoroughly studied aspects in fluid dynamics, it’s become hard to glean or detail new information on the simple physics of drag resistance from these classic experiments. But a team of engineers led by Brown University scientists managed to do so by bringing this problem to the surface—the water surface, that is.

Described in an new paper in Physical Review Fluids, the researchers created a small river-like channel in the lab and lowered spheres—made of different water repellent materials—into the stream until they were almost fully submerged by the flowing water.

The results from the experiment illustrate the fundamental—and sometimes counterintuitive—mechanics of how drag on a partially submerged object may be several times greater than drag on a fully submerged object made of the same material.

For instance, the researchers—led by Brown engineers Robert Hunt and Daniel Harris—found that drag on the spheres increased the moment they touched the water, no matter how water repellent the sphere material was. Each time, the drag increased substantially more than what was expected and continued to increase as the spheres were lowered, beginning only to drop when the spheres were fully beneath the water.

“There’s this intermediate period where the spheres going into the water are creating the biggest disturbances so that the drag is much stronger than if it were way below the surface,” said Harris, an assistant professor in Brown’s School of Engineering. “We knew the drag would go up as the spheres were lowered because they are blocking more of the steady flow, but the surprising thing was how much it goes up. Then as you keep pushing the sphere deeper, the drag goes back down.”

The study shows drag forces on partially submerged objects can be three or four times greater than on fully submerged objects. The largest drag forces, for instance, were measured just prior to the sphere becoming fully submerged, meaning water is flowing all around it but there’s still a small dry spot sticking out at the surface.

“You might expect how much of the sphere is in the water to correspond with how big the drag is,” said Hunt, a postdoctoral researcher in Harris’ lab and the study’s first author. “If so, then you might naively approximate the drag by saying that if the sphere is almost 100% in the water, the drag is going to be almost the same as if it was fully immersed beneath the surface. What we found is the drag can actually can be much larger than that—and not like 50% but more like 300% or 400%.”

The researchers also found that the sphere’s level of water repellency plays a key role in the drag forces it experiences. This is where things get a bit counterintuitive.

Drag forces on partially submerged objects can be three or four times greater than on fully submerged objects. The sphere coated with superhydrophobic material, making it very repellent to water, encountered more drag than the less water repellant spheres. Graph courtesy of the Harris Lab. Credit: Harris Lab

The experiment was done with three spheres that are otherwise identical except one was coated with a superhydrophobic material, making it very repellent to water, while the others were made of materials that are increasingly less water repellent.

Running the experiments, the researchers found that the superhydrophobic coating encountered more drag than the other two spheres. It was a surprise because they expected the opposite.

“Superhydrophobic materials are often proposed to reduce drag, but, in our case, we found that superhydrophobic spheres when almost fully immersed have a much larger drag than the sphere made of any other water repellency,” Hunt said. “In trying to decrease the drag, you might actually increase it substantially.”

The paper explains simple physics is the likely cause.

“The water wants nothing to do with this superhydrophobic sphere so it does anything that it can to, sort of, get out of the way of the sphere,” Harris said. “But what happens is much of it piles up in front of it, so there ends up being a wall of water that the sphere is hitting. Intuitively, you would think the water should slip by more freely. Physics actually conspires against that in this scenario.”

The findings from the paper may one day hold implications for designs and structures that operate at an air and water interface, like small autonomous vehicles. For now, the standalone physics of this basic research is interesting enough as studies on partially submerged objects aren’t as currently well characterized or understood in the field.

“We were surprised no one had made these measurements,” Harris said. “It’s such a simple idea but there’s just a lot of rich physics here.”

The researchers chose spheres as the first three-dimensional objects because of how simple their geometry is. They only have one length scale—the radius. The sphere acts as a starting point to be able to strip the physical mechanics down to its most fundamental principles before moving on to more complicated shapes.

“Starting from the simplest point, we look at what are the physics here and then as a next step we begin to apply our knowledge to more realistic structures, whether it’s emulating a biological structure or looking at manmade propulsive structures,” Harris said.

Hunt and fellow lab member Eli Silver designed the flume apparatus for creating the water stream experiment and programmed the motorized lift that lowers the spheres into the water channel. The work started as a collaboration with Yuri Bazilevs, a professor at Brown’s School of Engineering. It also included researchers from the University of Illinois Urbana-Champagne, who performed computer simulations.

More information: Robert Hunt et al, Drag on a partially immersed sphere at the capillary scale, Physical Review Fluids (2023). DOI: 10.1103/PhysRevFluids.8.084003

Provided by Brown University 

NIF fusion breakeven claims peer reviewed and verified by multiple teams

by Bob Yirka , Phys.org

NIF fusion breakeven claims peer reviewed and verified by multiple teams
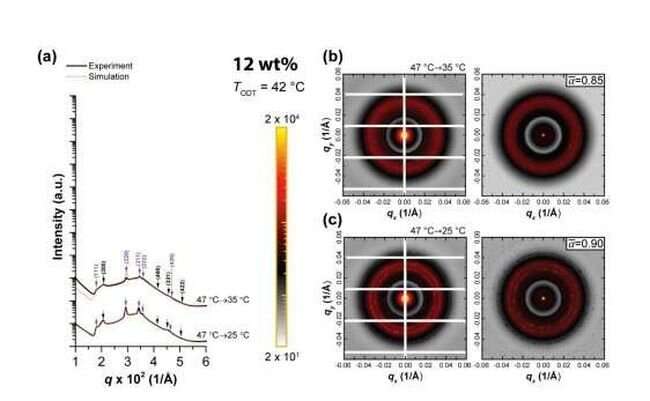
(a) Schematic of a typical ICF experiment at NIF, where 192 beams heat the interior of a gold hohlraum to TR∼300 eV in order to compress a 2 mm DT capsule to the conditions required for fusion. (b) Representative hohlraum emission spectrum observed by the Dante calorimeter showing thermal region (blue) and gold m-band emission (red). Credit: Physical Review Letters (2024). DOI: 10.1103/PhysRevLett.132.065104

Five independent teams of researchers have reviewed the work and claims made by a group at the National Ignition Facility (NIF) who announced in December 2022 that they had achieved the first laser-powered fusion reaction that exceeded “scientific breakeven”—in which more energy was produced by a manmade fusion reaction than consumed by the reaction.

All five teams have confirmed their claims. Three of the teams published their findings and conclusions in the journal Physical Review Letters; the other two teams published papers in the journal Physical Review E.

After many years of effort by multiple teams around the globe, the teams have confirmed that it should be possible to use fusion as a power source. The feat heralds a new era in nuclear fusion research—and possibly power generation.

At its most basic level, nuclear fusion is simple—when light elements are fused into heavier elements, a reaction results in the release of energy. Such reactions account for the energy emitted by stars, including the sun. Prior research has shown that recreating such reactions in a lab setting requires a different environment than that found in stars—higher temperatures are needed, which means using a lot of energy.

That has led to the goal of finding a way to generate fusion reactions that produce more power than is needed to produce them. To achieve that goal, the team at NIF fired lasers at a capsule containing two types of heavy hydrogen. This resulted in the release of X-rays that inundated the fuel, inciting the fusion process. In their groundbreaking experiment, the team at NIF used 2.05 megajoules of energy to power the lasers, and measured 3.15 megajoules of energy from the fusion reaction.

In their reviews, some of the teams conducting an analysis of the experiments note that while the team at NIF has achieved a monumental breakthrough, there is still a lot of work to be done before fusion can be used as a power source. Physicists need to scale up the technique, for example, and the yield needs to be much greater to justify its use in a commercial setting.

But they also found reasons for optimism—they found, for example, that during the experiment, the material in the capsule was unexpectedly reheated due to energy from the fusion reaction to energies higher than that provided by the lasers.

More information: H. Abu-Shawareb et al, Achievement of Target Gain Larger than Unity in an Inertial Fusion Experiment, Physical Review Letters (2024). DOI: 10.1103/PhysRevLett.132.065102

A. L. Kritcher et al, Design of the first fusion experiment to achieve target energy gain G>1, Physical Review E (2024). DOI: 10.1103/PhysRevE.109.025204

O. A. Hurricane et al, Energy Principles of Scientific Breakeven in an Inertial Fusion Experiment, Physical Review Letters (2024). DOI: 10.1103/PhysRevLett.132.065103

A. Pak et al, Observations and properties of the first laboratory fusion experiment to exceed a target gain of unity, Physical Review E (2024). DOI: 10.1103/PhysRevE.109.025203

M. S. Rubery et al, Hohlraum Reheating from Burning NIF Implosions, Physical Review Letters (2024). DOI: 10.1103/PhysRevLett.132.065104

Journal information: Physical Review Letters  Physical Review E 

© 2024 Science X Network

New approach to predict properties of undiscovered nuclei and border of nuclear landscape

by Liu Jia, 

New approach to predict properties of undiscovered nuclei and border of nuclear landscape
The 3D nuclide chart displaying the new isotopes predicted by the relativistic Hartree-Bogoliubov approach with the PC-L3R interaction. Experimentally confirmed isotopes (white region) and stable nuclei (black histograms in the middle of white region) are shown against the background of predicted isotopes. The height of each histogram represents the normalized mass excess of the predicted isotope. Credit: Lam Yi Hua and Lu Ning

With new generation radioactive-ion beam facilities, previously challenging experiments can be conducted for discovering new isotopes and for revealing physics related to the exotic nuclei far from the β-stability valley, which deepens the understanding of the origins of the chemical elements in the universe.

Researchers from the Institute of Modern Physics (IMP) of the Chinese Academy of Sciences (CAS), collaborating with Technische Universität München, predicted the existence of the  using the covariant density functional theory. The study was published in Atomic Data and Nuclear Data Tables.

To confirm the existence of newly discovered isotopes and the limit of an isotopic chain, the nuclear masses, radii, half-lives of these isotopes need to be determined. A set of reliable theoretical predictions of the characteristics (physics properties) of new isotopes serves as a guideline.

Measuring the last bound nuclei of isotopic chains not only examines the nuclear theory, but also advances the understanding of the extent of nucleosyntheses (syntheses of chemical elements) at the extreme astrophysical environment during neutron star mergers, core-collapsed supernovae, and X-ray bursts.

The covariant density functional theory is one of the most successful approaches for studying the nuclear structure. The theory describes the interactions among nucleons in the nuclear medium.

Nucleon-nucleon interactions can be described in the form of either point-coupling interaction (assuming nucleons as point-like particles interacting with one another) or meson-exchange interaction (assuming nucleons as some constituents communicating with one another by passing the messengers—mesons).

In this study, researchers plugged in one of these interactions to the relativistic Hartree-Bogoliubov approach to systematically explore the ground state properties of all isotopic chains from oxygen to darmstadtium.

These properties consist of the binding energies, one-neutron and two-neutron separation energies, root-mean-square radii of matter, of neutron, of proton and of charge distribution, Fermi surfaces, ground-state spins and parities.

“In fact, exotic nuclei that potentially exhibit new phenomena provide a testing ground for our understanding of quantum many-body system. The existence of about 2,500 nuclides has been experimentally proven. We expect new facilities promising in discovering more exotic nuclei and unraveling the phenomena that we have never seen before. Matching theoretical predictions with experimental findings could be exciting for us to cross-check our ,” said Liu Zixin from IMP, the first author of the paper.

Based on these ground-state properties of nuclei, the drip line of neutron and proton, halo phenomenon, and new magic number problem were discussed in detail. The predicted properties can provide guidance for future experiments and theoretical research in .

Revolutionizing next-generation VR and MR displays with a novel pancake optics system

by Compuscript Ltd

Revolutionizing next-generation VR and MR displays with a novel pancake optics
Figure 1. Concept of pancake optics systems. (a) Device configuration and (b) operation mechanism of conventional pancake optics system. (c) Configuration and (d) operation mechanism of double path pancake optics system. LCP, RCP, and LP represent left-handed circular polarization, right-handed circular polarization, and linear polarization. Credit: Opto-Electronic Advances (2024). DOI: 10.29026/oea.2024.230178

Augmented reality (AR), virtual reality (VR) and mixed reality (MR) have expanded perceptual horizons and ushered in deeper human-digital interactions that transcend the confines of traditional flat panel displays.

This evolution has unlocked a realm of exciting new possibilities, encompassing the metaverse, digital twins and spatial computing, all of which have found widespread applications in diverse fields such as smart education and training, health care, navigation, gaming, entertainment, and smart manufacturing.

For AR, VR and MR displays to become truly wearable for an extended period, there is a pressing need for compact and stylish form factor, low weight and low power consumption. Compared to Fresnel lenses and refractive lenses, polarization-based folded optics, often referred to as pancake optics, have emerged as a pivotal breakthrough for compact and lightweight VR headsets in the past few years, including Apple Vision Pro and Meta Quest 3.

These pancake optics greatly reduce the volume of a VR display, which in turn improves the center of gravity for the headset. However, the employed half-mirror causes considerable optical loss, which limits the maximum efficiency to 25%. Therefore, researchers are working toward a novel optical structure with the same folding capability as the pancake lens, but without the optical loss.

The authors of a new article published in Opto-Electronic Advances have extensively explored light engines, imaging optics, and power consumption of AR, VR and MR displays. A game-changing pancake optics system for reducing the volume of VR and MR displays, while keeping a high efficiency is proposed by this article.

The motivation behind this research is the increasing demand for wearable VR/MR headsets that are not only visually impressive but also comfortable for extended use. Present VR headsets with conventional pancake optics face challenges such as low optical efficiency, which in turn leads to increased thermal effect of the headset and short battery life due to the tremendous optical loss induced by the half mirror.

As depicted in Fig. 1 (a–b), only about 25% of the light (assuming no other loss) from the display panel reaches the observer’s eye. However, if the microdisplay emits unpolarized light, then the maximum optical efficiency is further reduced to 12.5%. The unused light will be either absorbed by the headset, which would increase the thermal effect, or become stray light, which would degrade the image quality.

The novel pancake optics system addresses this challenge by introducing a theoretically lossless design, incorporating a nonreciprocal polarization rotator, also known as Faraday rotator, between reflective polarizers as shown in Fig. 1 (c–d). In such a design, the nonreciprocal polarization rotator plays a critical role in folding the optical paths.

Revolutionizing next-generation VR and MR displays with a novel pancake optics
Figure 2. Schematic of reciprocal and nonreciprocal polarization rotators. Polarization rotation in (a) a reciprocal polarization rotator during forward propagation and (b) backward propagation. Polarization rotation in (c) a nonreciprocal polarization rotator through forward propagation and (d) backward propagation. Credit: Opto-Electronic Advances (2024). DOI: 10.29026/oea.2024.230178

Compared to reciprocal polarization rotator (e.g., half-wave plates), the nonreciprocal polarization rotator rotates the linearly polarized light irrespective of the optical wave’s propagation direction as Fig. 2 depicts. Consequently, a round trip of forward and backward propagations through the nonreciprocal polarization rotator results in a net rotation of 2θ.

Revolutionizing next-generation VR and MR displays with a novel pancake optics
Figure. 3. Validation of the novel pancake optics. (a) Folded laser beams in the novel pancake optics system. (b) Input image in the micro-OLED panel. (c) folded images in the novel pancake optics system. (d) Folded white images in the novel pancake optics system. (e) Multi-layer design for the broadband nonreciprocal polarization rotator. (f) Spectral response of the multi-layer design. Credit: Adapted from Opto-Electronic Advances (2024). DOI: 10.29026/oea.2024.230178

Preliminary experiments were conducted with a laser source and a micro-OLED panel to verify its optical efficiency and folding capability as depicted in Fig. 3 (a) and (b–c) respectively. The measured optical efficiency is around 71.5% due to the lack of anti-reflection (AR) coating and non-ideal performance of the employed reflective polarizers.

After using high-performance reflective polarizers and AR coating, the optical efficiency is improved to 93.2%, which is approaching the theoretical prediction. Additionally, four types of possible ghost images are analyzed in this novel pancake optical system. Through identifying the root cause of these ghost images, new methods are proposed to enhance the image contrast ratio. Additionally, a multi-layer structure is proposed to broaden the bandwidth of the Faraday rotator to enable full color displays.

As indicated in Fig. 3 (d–f), a three sequences of nonreciprocal polarization rotators and quarter-wave plates are adequate to achieve a broadband spectral response. Finally, to achieve a large field of view and truly compact formfactor, some possible candidates of thin-film magneto-optics material are analyzed and discussed in the article.

Overall, these demonstrations showcase the potential that such a novel pancake optics system could revolutionize next-generation VR and MR displays with lightweight, compact formfactor, and low power consumption. The pressing need for a thin-film Faraday rotator that is both magnet-free and highly transparent, while possessing a large Verdet constant in the visible region, is expected to inspire the next-round magneto-optic material development in the future.